Welcome to our Blog!

Follow our blog to learn more about the real estate market, community news, investing in real estate and life in Central Texas.

April 7, 2016

Building Wealth: First Rung on the Ladder is Housing

How Housing Matters is a joint project of the Urban Land Institute and the MacArthur Foundation. It is “an online resource for the most rigorous research and practical information on how a quality, stable, affordable home in a vibrant community contributes to individual and community success”.


A recent story they published, The First Rung on the Ladder to Economic Opportunity Is Housing, discussed the importance of having affordable housing available to as many families as possible because:


“The ladder to economic success can stretch only so high without the asset-building power of homeownership.

Home equity provides Americans with the ability to send their children to college with less student loan debt and is the primary source of funds for retirement. Half of the assets of Americans over age 55 are in their home.”


Bottom Line

We have often posted that the net worth of a family owning a home is 45 times greater than that of a family that rents. That is not a coincidence.

Posted in Buying a Home
April 5, 2016

Rent or Buy: Either Way You’re Paying A Mortgage

There are some renters that have not yet purchased a home because they are uncomfortable taking on the obligation of a mortgage. Everyone should realize that, unless you are living with your parents rent free, you are paying a mortgage - either your mortgage or your landlord’s.

As The Joint Center for Housing Studies at Harvard University explains:

“Households must consume housing whether they own or rent. Not even accounting for more favorable tax treatment of owning, homeowners pay debt service to pay down their own principal while households that rent pay down the principal of a landlord plus a rate of return.  

That’s yet another reason owning often does—as Americans intuit—end up making more financial sense than renting.”

Christina Boyle, a Senior Vice President, Head of Single-Family Sales & Relationship Management at Freddie Mac, explains another benefit of securing a mortgage vs. paying rent:

“With a 30-year fixed rate mortgage, you’ll have the certainty & stability of knowing what your mortgage payment will be for the next 30 years – unlike rents which will continue to rise over the next three decades.”

As an owner, your mortgage payment is a form of ‘forced savings’ that allows you to have equity in your home that you can tap into later in life. As a renter, you guarantee your landlord is the person with that equity.

The graph below shows the widening gap in net worth between a homeowner and a renter:

Rent or Buy: Either Way You’re Paying A Mortgage | Simplifying The Market

Bottom Line

Whether you are looking for a primary residence for the first time or are considering a vacation home on the shore, owning might make more sense than renting with home values and interest rates projected to climb.

Posted in Buying a Home
April 1, 2016

Homeownership is a Great Investment!

Don't Be Fooled... Homeownership Is A Great Investment! [INFOGRAPHIC] | Simplifying The Market

March 30, 2016

Past, Present & Future Home Values

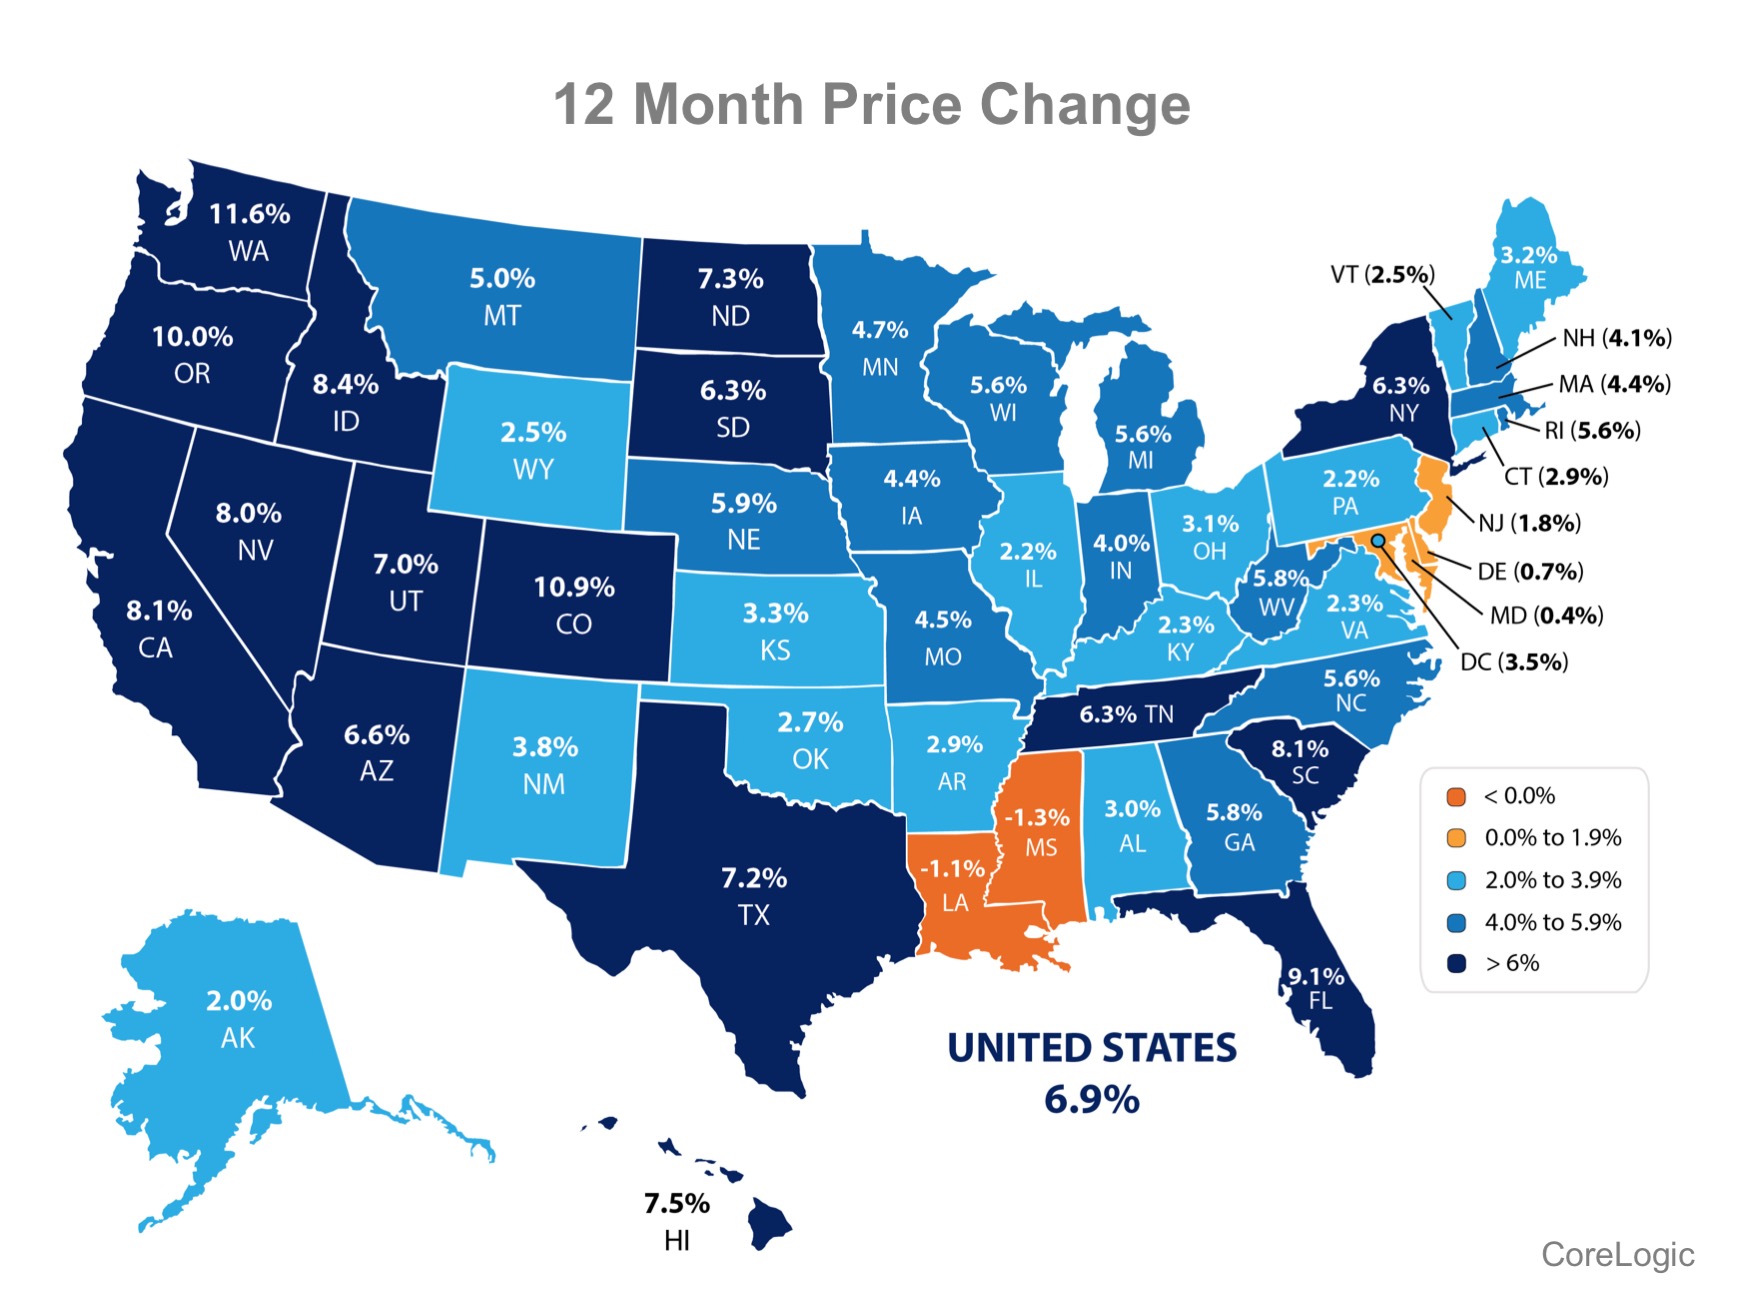
In CoreLogic’s latest Home Price Index, they revealed home appreciation in three categories: percentage appreciation over the last year, over the last month, and projected appreciation over the next twelve months.

Here are state maps for each category:

The Past – home appreciation over the last 12 months

Past, Present & Future Home Values | Simplifying The Market

The Present – home appreciation over the last month

Past, Present & Future Home Values | Simplifying The Market

The Future – home appreciation projected over the next 12 months

Past, Present & Future Home Values | Simplifying The Market

Bottom Line

Homes across the country are appreciating at different rates. As we have mentioned before, the rate of home price appreciation across the country is due to a strong housing market reacting to supply and demand, and not a new housing bubble.

If you plan on relocating to another state, and are waiting for your home to appreciate more, you need to know that the home you will buy in another state may be appreciating even faster.

Let's meet up so I can guide you through your next steps and help you decide what's right for you.

March 28, 2016

The Top 5 Reasons You Should Not For Sale By Owner

In today's market, with homes selling quickly and prices rising, some homeowners might consider trying to sell their home on their own, known in the industry as a For Sale by Owner (FSBO). There are several reasons this might not be a good idea for the vast majority of sellers.


Here are five of those reasons:


1. There Are Too Many People to Negotiate With


Here is a list of some of the people with whom you must be prepared to negotiate if you decide to For Sale By Owner:


  • The buyer who wants the best deal possible
  • The buyer’s agent who solely represents the best interest of the buyer
  • The buyer’s attorney (in some parts of the country)
  • The home inspection companies, which work for the buyer and will almost always find some problems with the house
  • The appraiser if there is a question of value


2. Exposure to Prospective Purchasers


Recent studies have shown that 89% of buyers search online for a home. That is in comparison to only 20% looking at print newspaper ads. Most real estate agents have an internet strategy to promote the sale of your home. Do you? 


3. Results Come from the Internet


Where do buyers find the home they actually purchased?


  • 44% on the internet
  • 33% from a Real Estate Agent
  • 9% from a yard sign
  • 1% from newspaper


The days of selling your house by just putting up a sign and putting it in the paper are long gone. Having a strong internet strategy is crucial.


4. FSBOing has Become More and More Difficult


The paperwork involved in selling and buying a home has increased dramatically as industry disclosures and regulations have become mandatory. This is one of the reasons that the percentage of people FSBOing has dropped from 19% to 8% over the last 20+ years.


The 8% share represents the lowest recorded figure since NAR began collecting data in 1981.


5. You Net More Money when Using an Agent


Many homeowners believe that they will save the real estate commission by selling on their own. Realize that the main reason buyers look at FSBOs is because they also believe they can save the real estate agent’s commission. The seller and buyer can’t both save the commission.


Studies have shown that the typical house sold by the homeowner sells for $210,000 while the typical house sold by an agent sells for $249,000. This doesn’t mean that an agent can get $39,000 more for your home as studies have shown that people are more likely to FSBO in markets with lower price points. However, it does show that selling on your own might not make sense.


March 24, 2016

Further Proof This Isn’t a Housing Bubble

Two weeks ago, we posted a blog which explained that current increases in home prices were the result of the well-known concept of supply & demand and should not lead to conversations of a new housing bubble. Today, we want to look at home prices as compared to current incomes.

Here is a graph showing the monthly mortgage payment on a median priced home in the U.S. over the last 25 years:

Further Proof This Isn’t a Housing Bubble | Simplifying The Market

Mortgage payments are currently well below the historic average over that time period. Purchasers are not overextending themselves to buy a home like they did on the run-up to the housing crash.

Lawrence Yun, the Chief Economist at the National Association of Realtors, recently explained in a Forbes article:

“Even though home prices are climbing far above people’s income, exceptionally low mortgage rates have permitted people to buy a home without overstretching their budget. For someone making a 20% down payment, the monthly mortgage payment at today’s mortgage rates would take up 15% of a person’s gross income. During the bubble years, it was reaching 25% of income. The long-term historical average is around 20%. Therefore, a middle-income household does not need to overstretch their budget much if at all to buy a typical home.”

Bottom Line

Due to low interest rates, demand for housing has dramatically increased. This has caused a jump in home prices. However, low interest rates have also allowed the monthly cost of buying a home to remain well below historic norms. We are in a strong housing market, not a housing bubble.

March 23, 2016

91.5% of Homes in the US Have Positive Equity

CoreLogic’s latest Equity Report revealed that one million borrowers regained equity in their homes in 2015. The outlook for 2016 remains positive as well, as an additional 850,000 properties would regain equity if home prices rose another 5% this year. 

The study also revealed:

  • 95% of homes valued over $200,000 now have a positive equity position
  • 87% of homes valued under $200,000 have entered a positive position
  • The 11.5% growth in home equity in Q4 marked the 13th consecutive quarter of double digit gains

Below is a map showing the percentage of homes with a mortgage, in each state, that have positive equity. (The states in gray have insufficient data to report.)

91.5% of Homes in the US have Positive Equity | Simplifying The Market

Significant Equity Is On The Rise

Anand Nallathambi, President & CEO of CoreLogic, believes this is great news for the “long-term health of the U.S. economy.” He went on to say:

“The number of homeowners with more than 20% equity is rising rapidly. Higher prices driven largely by tight supply are certainly a big reason for the rise, but continued population growth, household formation and ultralow interest rates are also factors.”

Of the 91.5% of homeowners with positive equity in the US, 72.6% have significant equity (defined as more than 20%). This means that nearly three out of four homeowners with a mortgage could use the equity in their current home to purchase a new home now.

The map below shows the percentage of homes with a mortgage, in each state, with significant equity.

91.5% of Homes in the US have Positive Equity | Simplifying The Market

Bottom Line

If you are one of the many homeowners who is unsure of how much equity you have in your home and are curious about your ability to move, let's meet up to evaluate your situation.

March 14, 2016

March Madness!!!!

March 14, 2016

What If I Wait Until Next Year To Buy A Home?

As a seller, you will be most concerned about ‘short term price’ – where home values are headed over the next six months. As either a first-time or repeat buyer, you must not be concerned only about price but also about the ‘long term cost’ of the home.

Let us explain.

There are many factors that influence the ‘cost’ of a home. Two of the major ones are the home’s appreciation over time, and the interest rate at which a buyer can borrow the funds necessary to purchase their home. The rate at which these two factors can change is often referred to as “The Cost of Waiting”.

What will happen over the next 12 months?

According to CoreLogic’s latest Home Price Index, prices are expected to rise by 5.5% by this time next year.

Additionally, Freddie Mac’s most recent Economic Commentary & Projections Table predicts that the 30-year fixed mortgage rate will appreciate to 4.5% in that same time.

What Does This Mean to a Buyer?

Here is a simple demonstration of what impact these projected changes would have on the mortgage payment of a home selling for approximately $250,000 today:

What If I Wait Until Next Year To Buy A Home? | Simplifying The Market


Posted in Buying a Home
March 10, 2016

Yes, Home Prices Are Rising. No, a New Housing Bubble is NOT Forming

We recently reported that home prices are continuing to rise across most of the nation. This has created concern in some pundits that a housing bubble, like we saw ten years ago, is forming again. We want to explain why these concerns are unfounded.


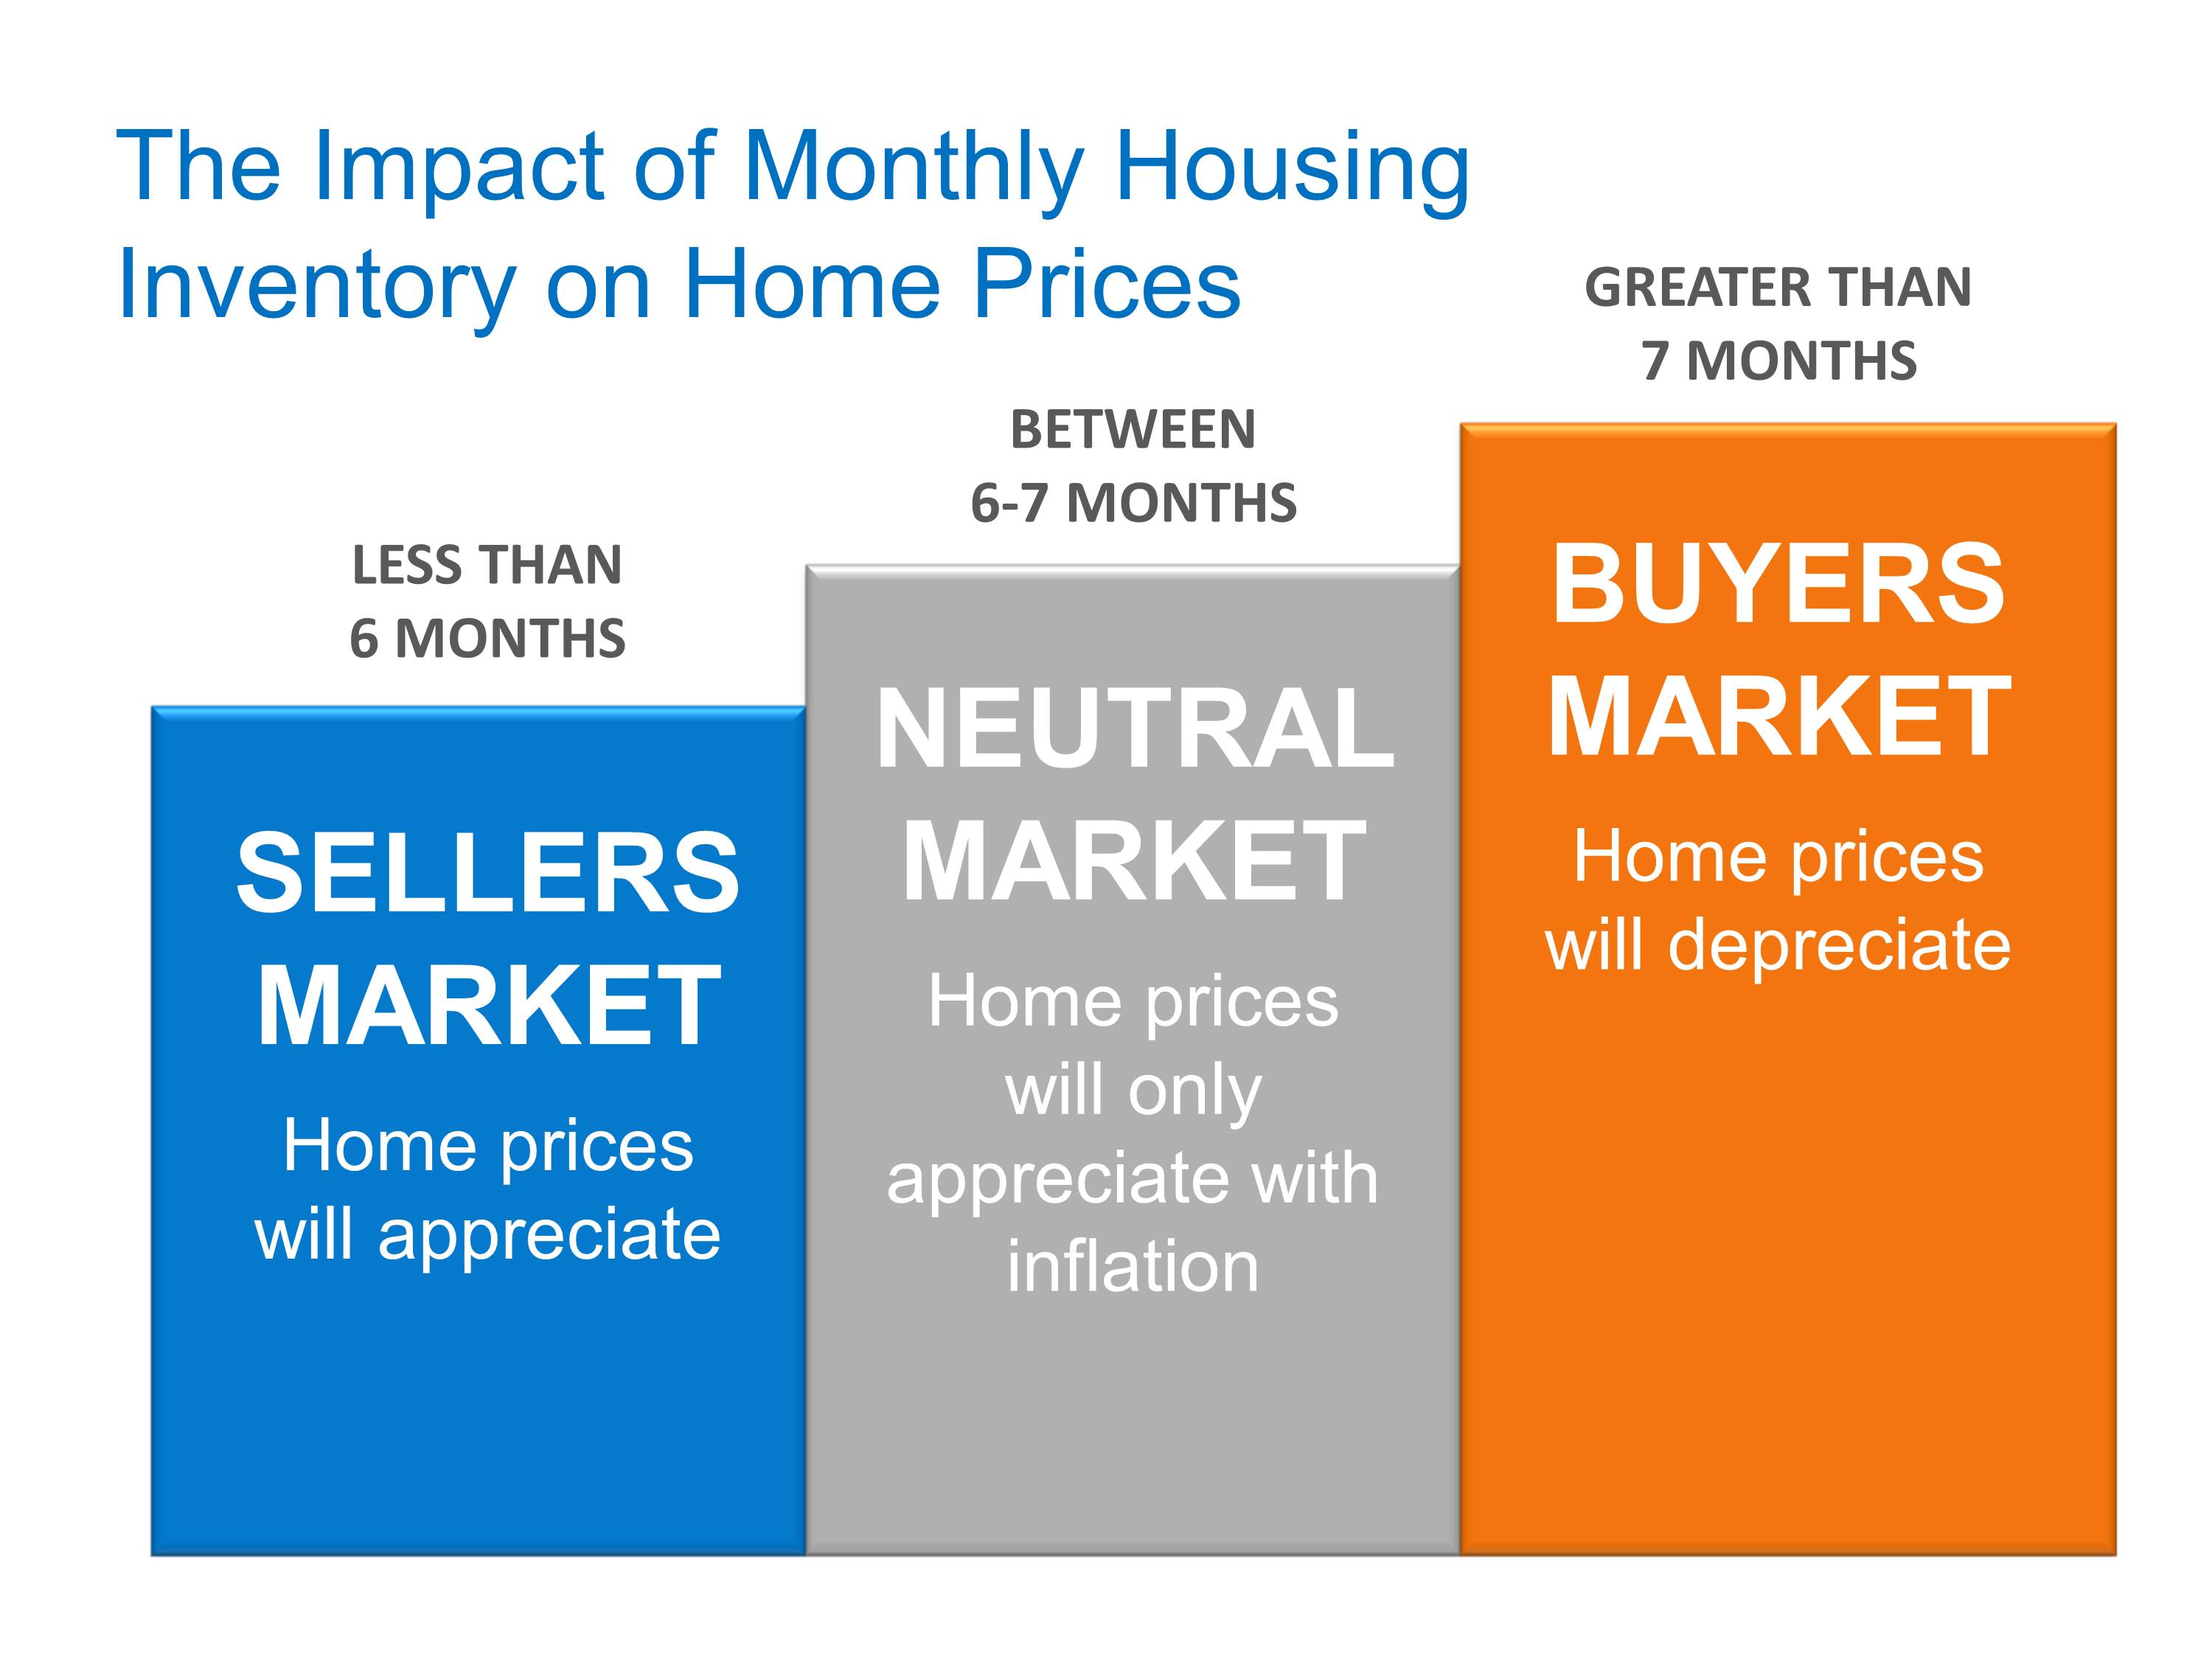
The current increase in home values can be easily explained by the theory of supply and demand. Right now, the number of families looking to purchase a home is greater than the supply of homes on the market.

Here is a chart that explains how the months’ supply of housing inventory impacts home values:

Yes, Home Prices Are Rising. No, a New Housing Bubble is NOT Forming | Simplifying The Market

According to the latest Existing Home Sales Report from the National Association of Realtors, there is currently a four-month supply of inventory. That puts us in the blue section of the above graphic. Home prices should be appreciating.

The difference in 2006…

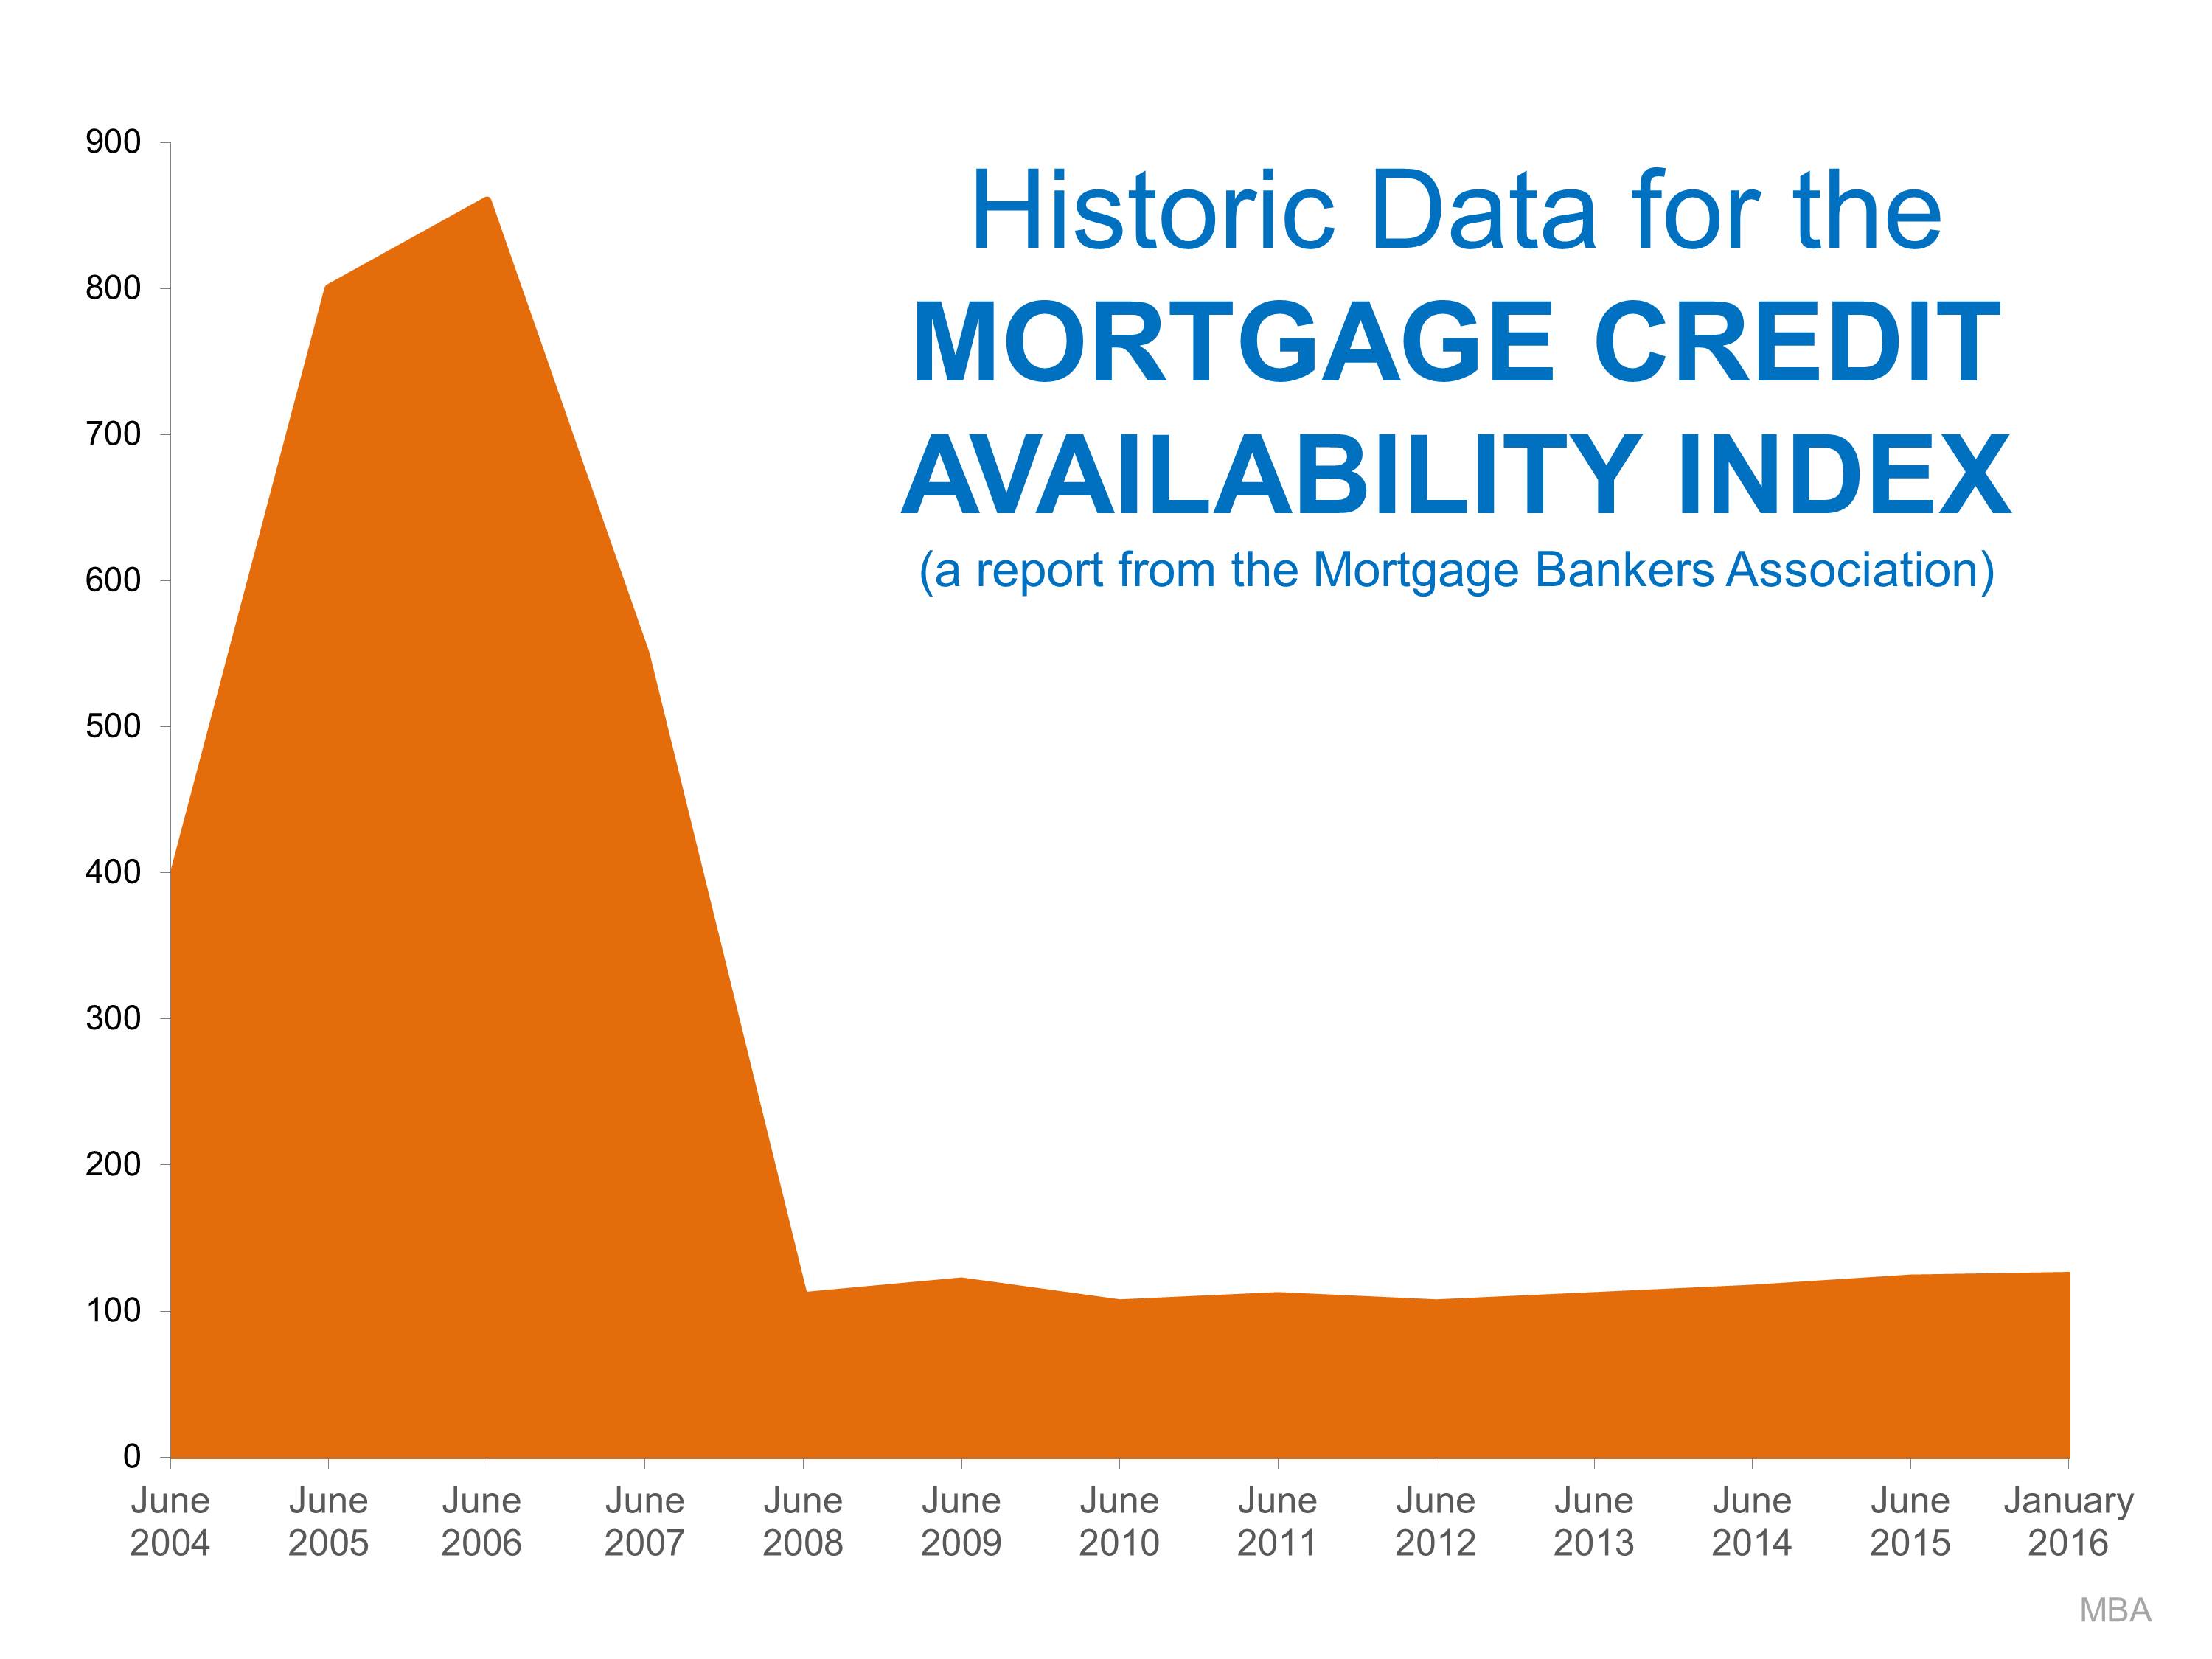
A decade ago, the demand for housing was artificially boosted by lending standards that were far too lenient. Today, the strength of the demand for housing is legitimate, as lending standards are nowhere near what they were a decade ago.

For proof of this, let’s look at a graph of the Mortgage Bankers’ Association’s Mortgage Credit Availability Index:

Yes, Home Prices Are Rising. No, a New Housing Bubble is NOT Forming | Simplifying The Market

The higher the number, the easier it was to get a mortgage. We can see that from June 2005 to June 2007, mortgage standards were much more lenient than they have been over the last nine years.

Bottom Line

Today’s price increases, unlike those a decade ago, are the result of qualified buyer demand exceeding the current inventory of homes available for sale. Once the supply increases, prices will level out.